The perfect party playlist
statistically significant, of course
Overview
Creating a playlist isn’t about throwing together a bunch of random songs—it’s about curating an experience. The right tracks, in the right order, can set the mood, build momentum, and keep people engaged from start to finish.
With a dataset of 15,000 songs, I took a data-driven approach to answer a simple yet essential question:
What makes the perfect party playlist?
By clustering songs into distinct energy profiles, uncovering the key drivers of popularity, and carefully sequencing them for flow, I designed a playlist that doesn’t just play—it elevates the moment.
Now, let’s break it down.

Cluster 2: upbeat and catchy
Loud
High Energy and Dance Appeal
Low Acoustic Properties
Positive Tone
Low Variation
Step 2: Regression Analyses- drivers of popularity
After clustering the songs to add meaning to the data, I used linear regressions to assess which song properties had significant effects on a song’s popularity. Findings showed that Danceability, Energy, and Loudness had the strongest effect on Popularity. Using these variables, I then ran individual regressions within each of the clusters.
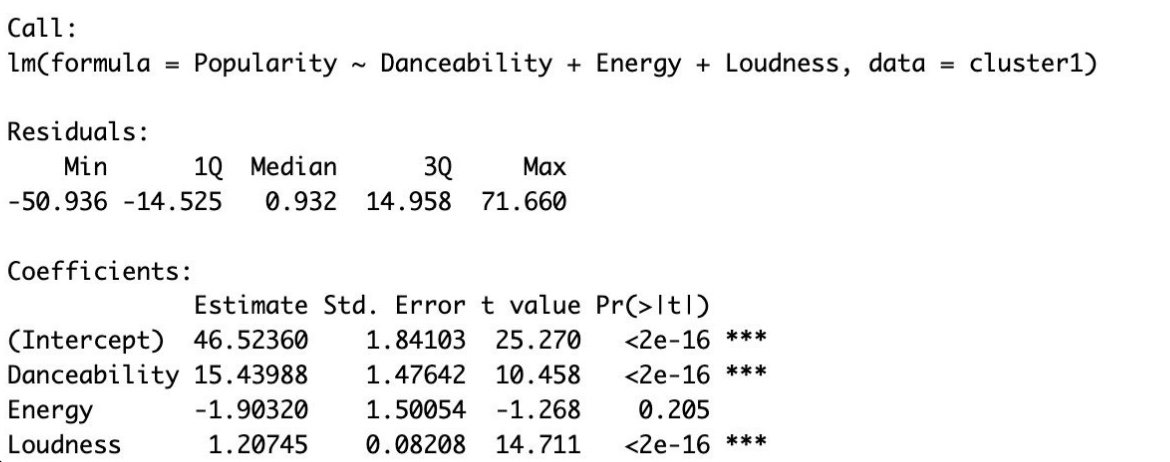
Cluster 1
The results in cluster 1 show that Danceability and Loudness have positive effects on a song’s popularity. Results also show that energy has a negative effect, although it is not significant. Further testing show that the top 3 genres in cluster 1 are pop, country, and jazz.
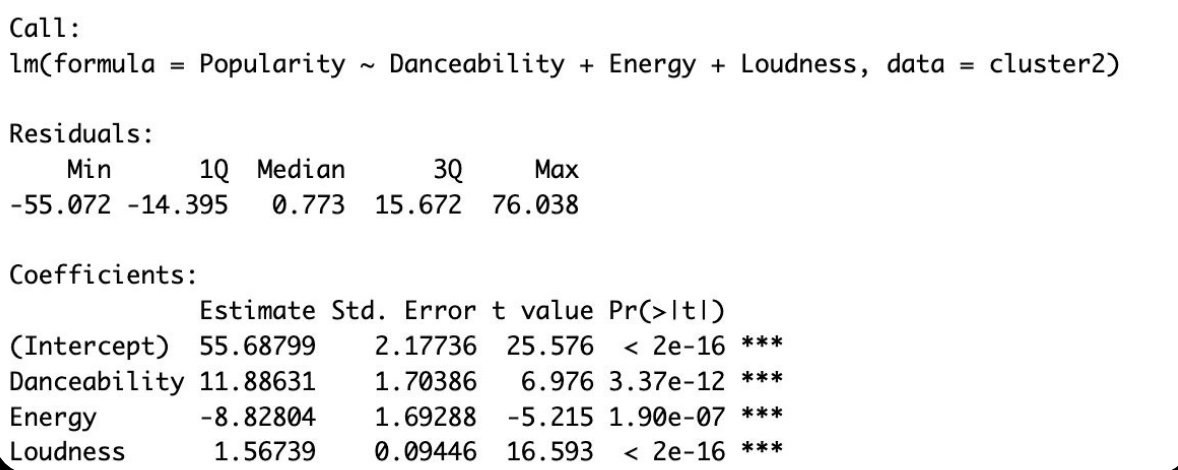
Cluster 2
The results in cluster 2 show that Danceability and Loudness have positive effects on a song’s popularity. Results also show that energy has a negative effect. All effects are statistically significant, having a strong impact on popularity in this cluster. The top 3 genres in this cluster include pop, EDM, and disco.
Cluster 3
The results in cluster 3 show that Danceability and Loudness have positive effects on a song’s popularity. Results also show that energy has a negative effect. All effects are statistically significant, having a strong impact on popularity in this cluster. Although significant, these effects are less strong than in cluster 3. The top 3 genres in this cluster include pop, punk, and metal.
Step 3: mixing and mastering
Based on the results in the analyses, I knew that the perfect party songs were in cluster 2- these are for my party people.
By filtering and sorting through the data, I curated a playlist that is not only likely to keep the vibes going all night long, but is statistically significant in doing so. Of course, the first song on the playlist is none other than Mr. Brightside. Don’t just take my word for it, though! Give it a listen here!
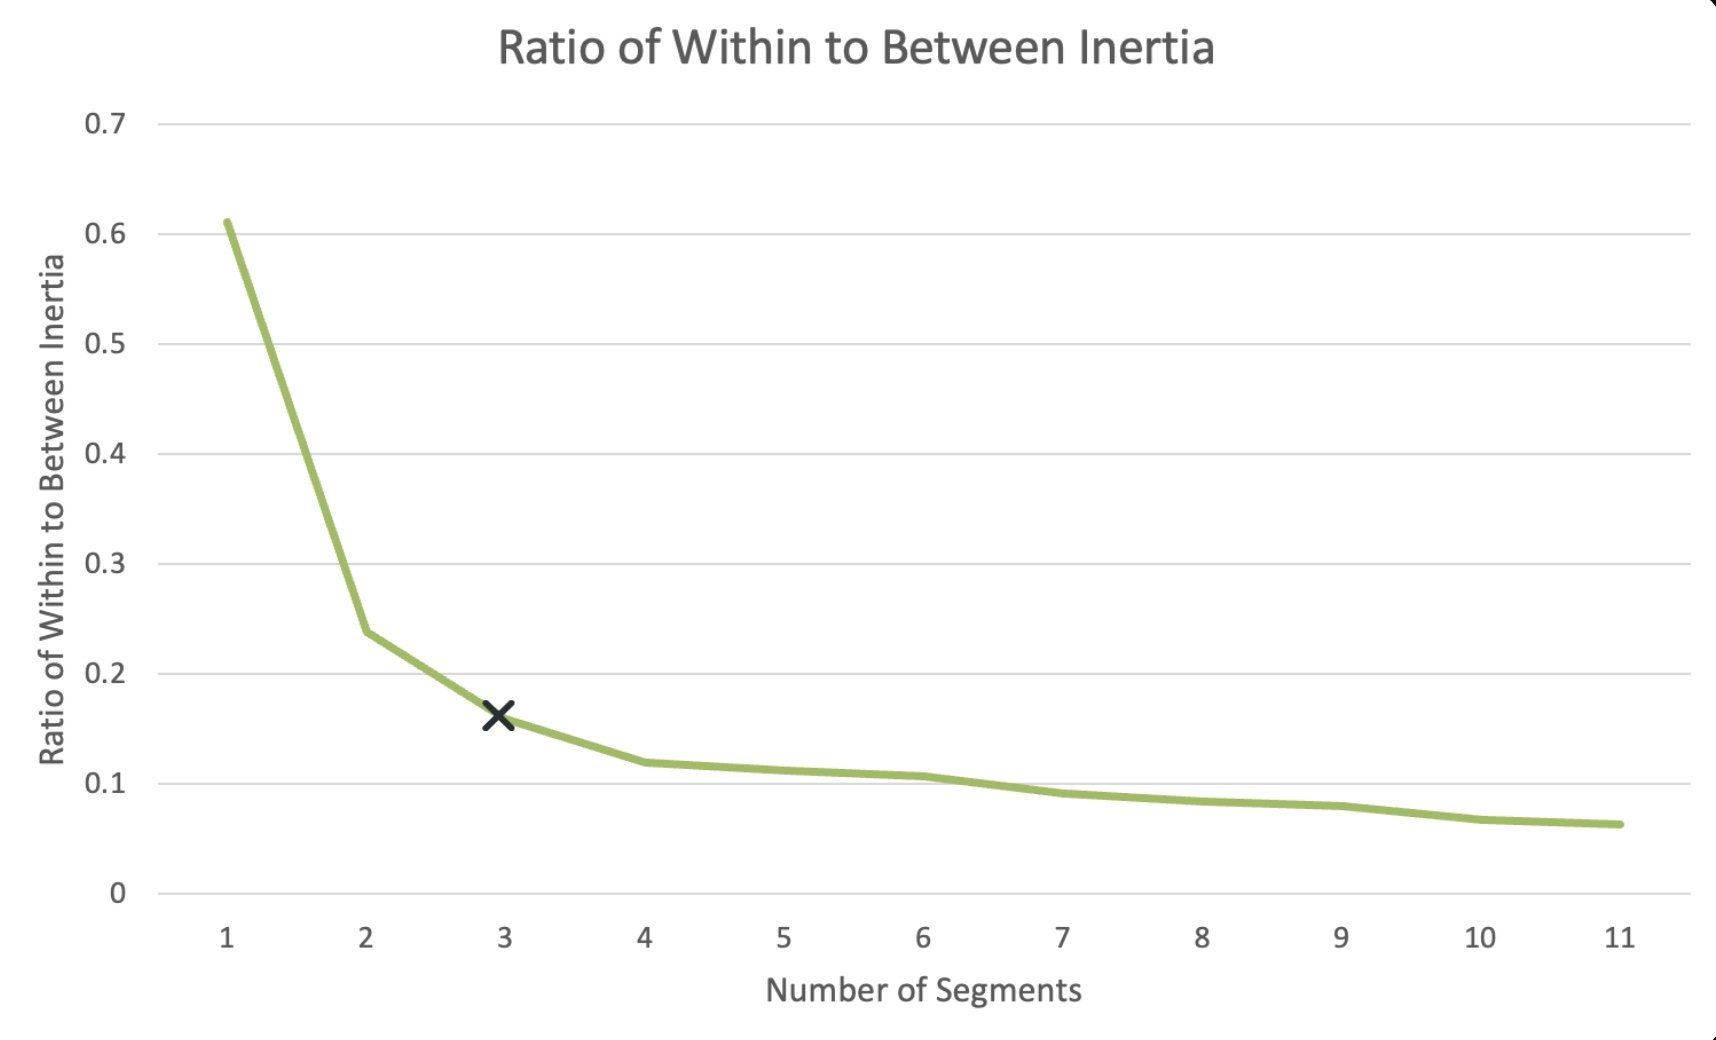
Figure 1: Elbow plot
Cluster 3: intense and fast-paced
Lower Danceability but Higher Energy
Loud but Acoustic
Higher Speechless
Fast Tempo
High Variation
Step 1: Cluster analysis
To provide meaning to the original list of 15,150 tracks, I began with a cluster analysis. Using the elbow plot in Figure 1, I found that 3 distinct clusters would allow for enough between cluster variation but limit within cluster variation.
Cluster characteristics
Cluster 1: Balanced and mellow
Moderate Danceability and Energy Scores
Quiet
Balanced Instrumental and Vocal Elements
Moderate Valence and Tempo
Cluster 2
Cluster 3
